The mathematical shapes and structures
inside trained AI models.
We read the papers that report them, extract each finding, and catalogue the objects — carriers, operators, properties and hypotheses — each placed by its mathematical role, with the model it was found in and the paper that reported it.
The purpose is to measure how reproducible and how equivalent that mathematics is: across papers, across research groups, across modalities, families and architectures.
Structure arises inside trained models on its own.
It is reported across many papers, by many separate groups, in language that rarely matches. Three questions follow.
How often do these structures appear in models, and by which methods can they be found?
Do different structures arise, empirically, in different families and architectures, or across different modalities?
How far have the results been reproduced across the field?
The map gives a view over the area — a place to form ideas and questions, and to find methods for your own work.
The selection rule and the method →The input object is a paper.
Every record in the map starts as one paper, read to primary source. Nothing is written from an abstract, and every screened candidate ends with a dated verdict — added, rejected or deferred.
Swept from arXiv, OpenAlex and the ACL Anthology, then tagged against criteria (a), (b), (c).
The identifier resolves, the title matches, the full text is read. The exact claim, model, site, metric and conditions are extracted.
One measured claim: structure × model × method × paper. A paper can yield several.
The observation is linked to its structure, method, model and family — and to a hypothesis where it bears on one.
Breadth and independence are derived from the records: authors, architecture classes, domains, families.
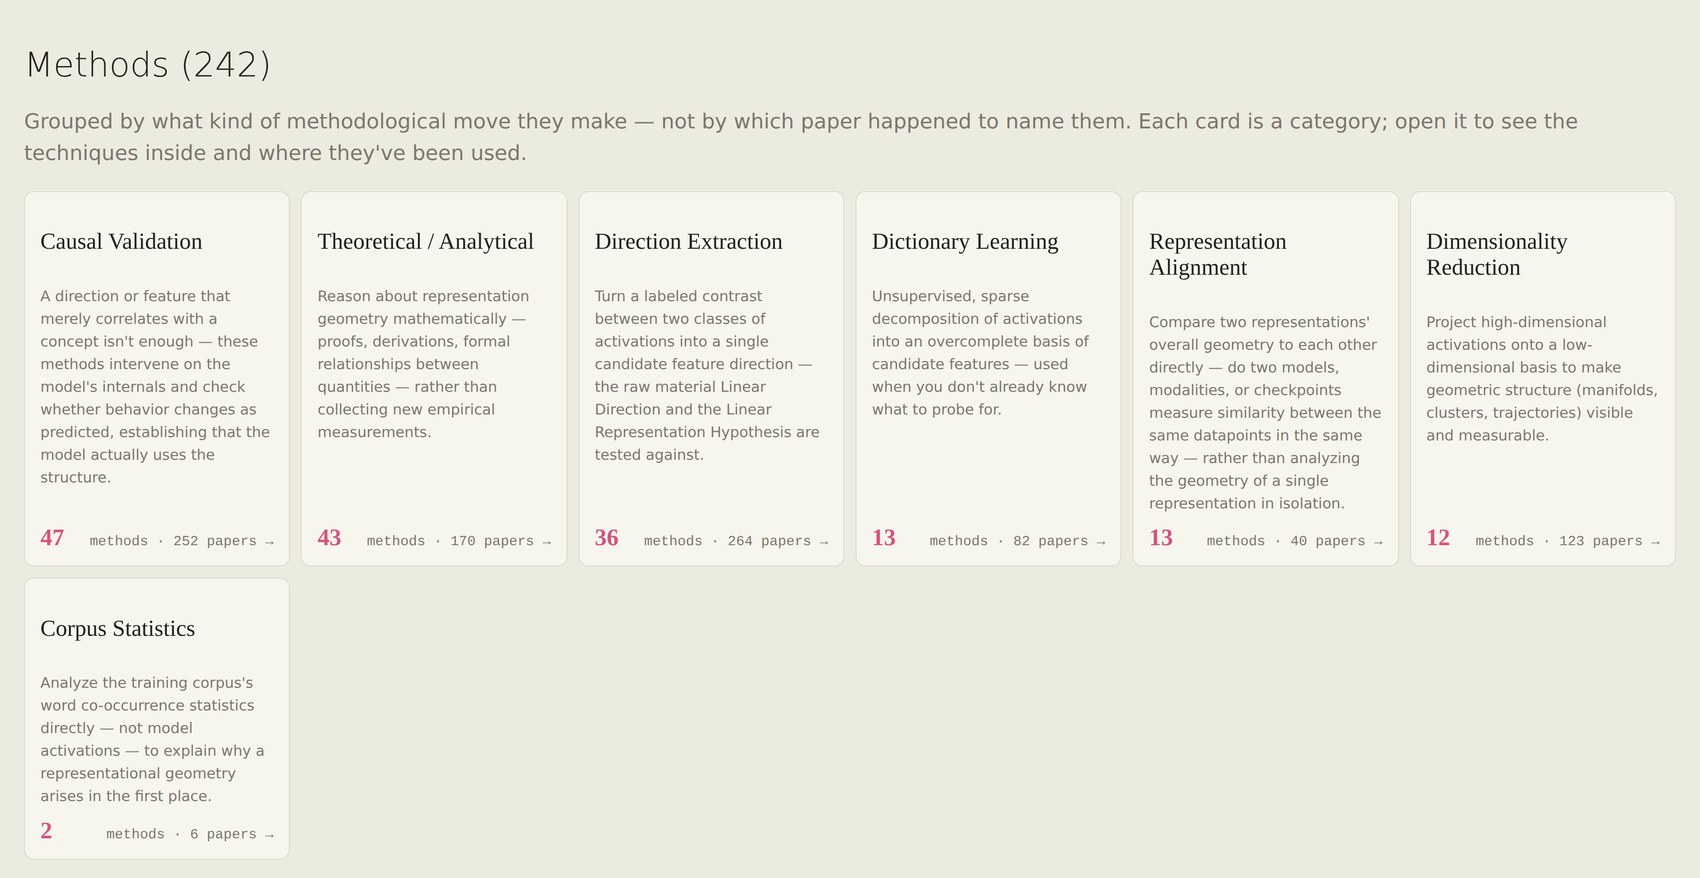
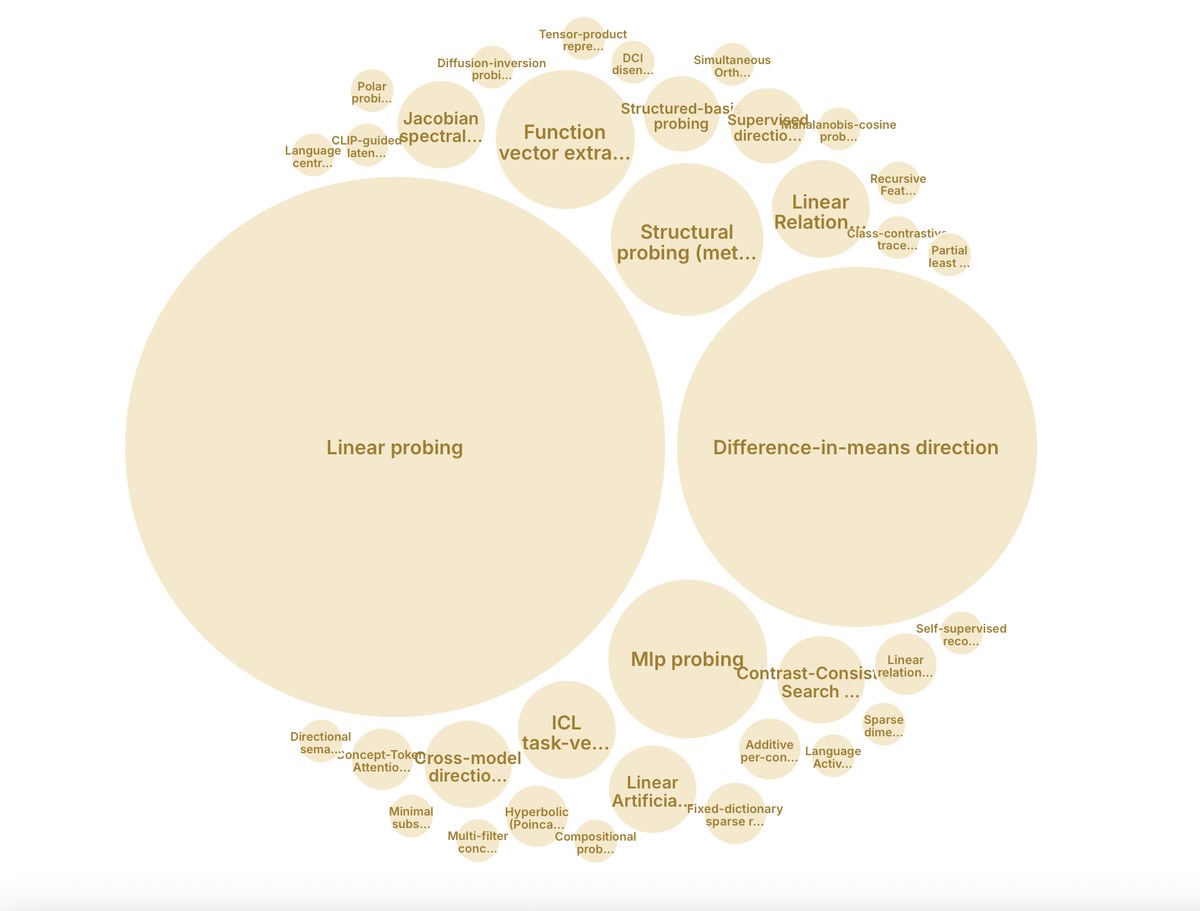
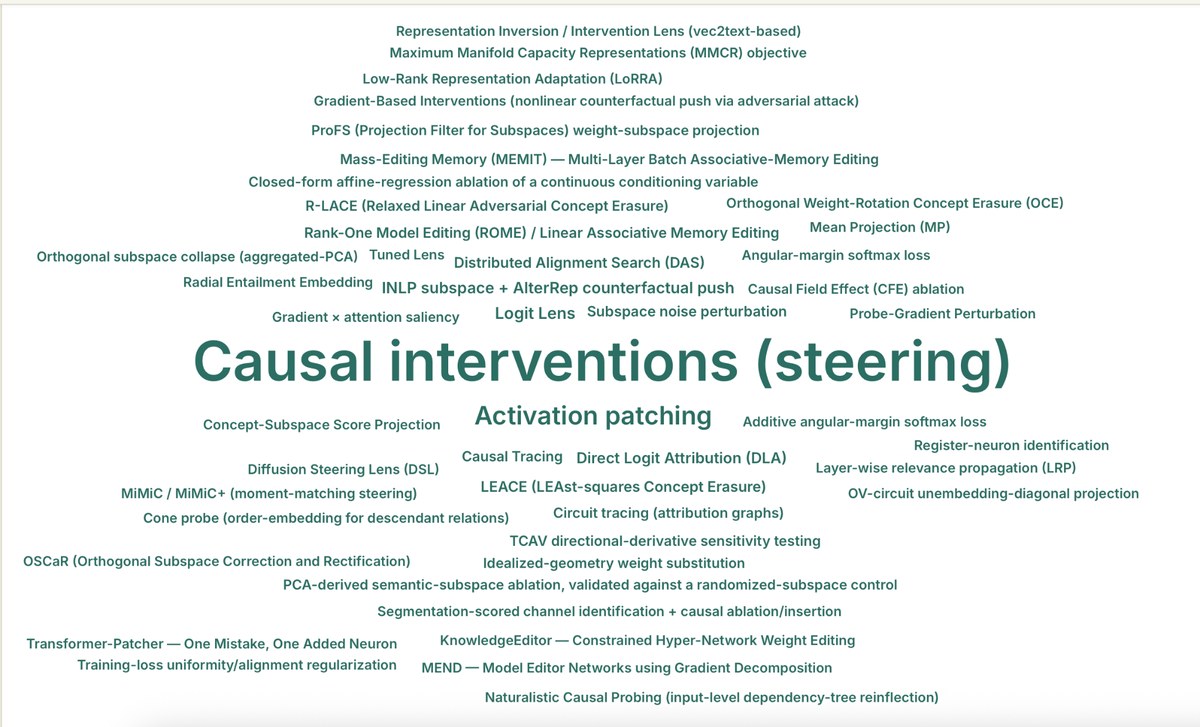
One graph, coloured by class.
Structures cluster by their ontological sort — objects, tools, properties — linked to the methods that find them and the papers that report them. Depth is a slider: collapse to sorts, expand to leaves.